Day 6 of Advanced Mathematical and Statistics Class

It was the sixth day of advanced mathematical and statistics class. Today, my groupmate Ahmed and I worked on analysing the fatal police shootings dataset. We cleaned and preprocessed the data, ensuring the correct classification of race, gender, and body camera usage. Together, we formulated key research questions and planned statistical comparisons and visualizations to highlight important patterns.

I focused on conducting statistical tests like chi-square and correlation analysis to identify significant relationships between variables, while Ahmed worked on descriptive statistics and population normalization. I also handled the Python scripting for statistical tests, whereas Ahmed wrote the data visualization scripts. We both debugged the code to ensure accuracy and reproducibility.

For the report, I wrote about mental health factors, circumstances of shootings, and body camera usage trends in the Findings section, while Ahmed covered racial disparities, age/gender analysis, and per capita rates. I also structured the Methodology (Appendix A) for clarity, and together, we worked on the Discussion section, summarizing key insights and policy recommendations.

Day 5 of Advanced Mathematical and Statistics Class

It was the fifth day of advanced mathematical and statistics class. The class started off as my friend Mahnoor presented her analysis on the fatal police shootings dataset. Her goal was to identify counties where a particular racial group, despite having a smaller population percentage, experienced a higher percentage of shooting deaths. She shared her findings through several graphs, which clearly showed that in some counties, certain racial groups with lower populations had a disproportionately higher rate of shooting fatalities.

The analysis was really great and raises several questions like:

  • What factors could be contributing to these higher shooting fatalities for certain racial groups?
  • Is it linked to socio-economic conditions of these races?
  • Does this have any connection with literacy?
  • Or is it due to racial discrimination?


Day 4 of Advanced Mathematical and Statistics Class

It was the fourth day of advanced mathematical and statistical class. Professor Gary presented us a report of “Police shootings time series”, where we discussed different types of statistical methods that could be carried out in a set of data.

He gave us a brief description of methods like mean, min, max, median, skewness, kurtosis etc. He taught us with standard deviation of a set of data where we measure how spread out each data points are.

We discussed with various plotted graphs like histograms, quantile plots and list plots to understand the idea of these statistical methods.

Day 3 of Advanced Mathematical and Statistics Class

It was the third day of advanced mathematical and statistics class. As usual, we began discussing new and unique questions that was raised by students. Professor Gary presented us a statistical report on “Number of shootings by police stations” which was made by him that includes statistical representations and values. We then discussed about ANOVA( Analysis of Variance) which is a statistical test that is used for analysing means of more than two groups.

After on, me and my friend started discussing about different possibilities of statistical models and representations that could be made out from the dataset we have. Here are few representations of data that I have made for easier understanding and analysis of the dataset:


Day 2 of Advanced Mathematical and Statistics Class

It was the second day of Advanced Mathematical and Statistics class. The class started off with Gary giving us a brief idea about the geographical structure of the United States. He drew a flowchart starting with the USA and that followed by states and counties. He pointed out the differences in the sizes of the counties. On one side of the country, there were noticeably larger counties, while the rest of the country had the usual, more regular-sized counties.

After giving us a brief but insightful overview of county sizes and their geographical implications, Gary shifted back to the fatal police shooting dataset where students were asked to come up with new and interesting questions and insights made up from analyzing the dataset.

Few questions that I have in my mind based on the analysis are:

  • Is there any difference in the outcomes of fatal police shootings when the body cameras are in use versus when they are not?

– This focuses on whether body cameras affect the legal or public consequences for officers involved in shootings.

  • What are the most common circumstances leading to fatal police shootings?

–  For example, were the shootings tied to a specific crime, resisting arrest or mental illness issues?

  • How do fatal police shootings vary by urban vs. rural areas?

– Are there more shootings in densely populated urban areas or in rural areas with smaller police departments?


Thank you!!


My first class on Advanced Mathematical Statistics by Gary Davis

It was my first day of Advanced Mathematical Statistics class, taught by Gary Davis. The class started of as Gary began calling out the names of students from a sheet of paper, and there he goes calling out the first name, ” who is Chandrakanth? “, yeah it was me! , I raised my hand and answered, “its me sir”, and he asked me that whether my first name is “Fnu” and I said yes. He replied as it is interesting to have two people in the class with their first name as “Fnu”. Then he continued calling out everyone’s name.

Gary gave us a brief introduction to the course by presenting his screen to us, where he showed us the course texts, course structure, how the assessments are structured and how it works, academic integrity etc.

After that, Gary asked us to create our own WordPress site where we would post our journals throughout the course. This was a bit of a surprise, but it made sense because it would allow us to track our progress and share our thoughts on what we were learning.

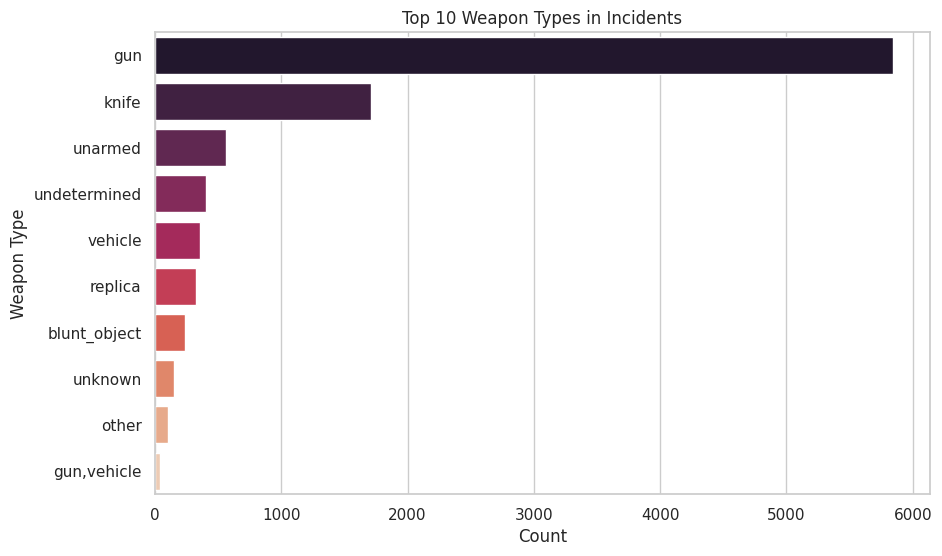
Next, Gary gave us a dataset of the Washington-Post-police-shootings. We were asked to analyze it and come up with questions based on the data. The idea was to really dive into the dataset and think critically about it. We were told to prepare our questions and ask them when we were ready.

As everyone started working with the dataset, many students asked interesting questions about patterns and trends they noticed. When it was my turn, I asked Gary a question that had been on my mind: “On what basis is a person considered mentally ill, if the person is already shot dead?”

He responded by sharing his own life experience which I don’t want to share here. His story made me realize that even though statistics are important, it cannot capture the full human experience behind the data.

Overall, the class was really interesting. I have learned that statistics is not just about numbers, it is about understanding the bigger picture. I am looking forward for the next class on thursday.


About me

Hi, I’m Chandrakanth! I’ve recently completed my BCA in Data Science, and I’m passionate about using data to uncover insights and solve problems. I’m fascinated by how statistics and algorithms can help us understand the world around us.

With a strong foundation in data analysis, machine learning, and statistics, I’m always eager to learn more and apply my skills in new ways. Whether it’s making predictions, analyzing trends, or creating data visualizations, I love exploring how data can drive better decisions.